First question
When profiling a Datamapper the performance seems to be measured once, aka the Datamapper steps are run and measured once. The template profiling instead performs several iterations. Why is that?
Dataming profiling
For instance this is the profiling of a datamapper configuration. The major offender is “Popola tabella di dettaglio” which indeed loops a detail table and for each entry queries an API hosted on the same machine of the OLConnect server, so ping is practically 0.
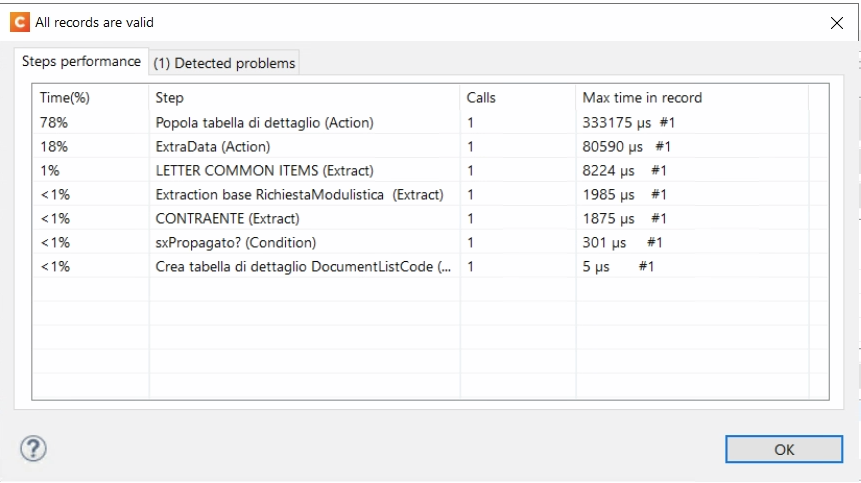
DATA
The API latency is around 2 milliseconds to process the request and give the reponse needed to fill some additional fields in the detail table.
The step took 333 milliseconds to complete, the data source had 10 entries, so 10 roundtrips were made for a total 20 ms process time on the backend side.
Can it be that the remaining 313 ms were to simply perform 10 addRow()?
Executing the datamining through the OLConnect API has a 900% time increase
Regardless of this profiling which overall adds up to roughly 500 milliseconds (still an excellent performance!), when actually performing the datamining step through the OLConnect API it takes up to 3 seconds to complete, how so?
The API being used is Process_Data_Mapping with a datamining configuration and a file already uploaded to the filestore.
I am measuring only the time it takes from the Process Datamapping POST to the the Get Progress of Operation 100%. Why the performance measured from the Designer Datamapper are so much different from the actual execution time through OLConnect API?
Template
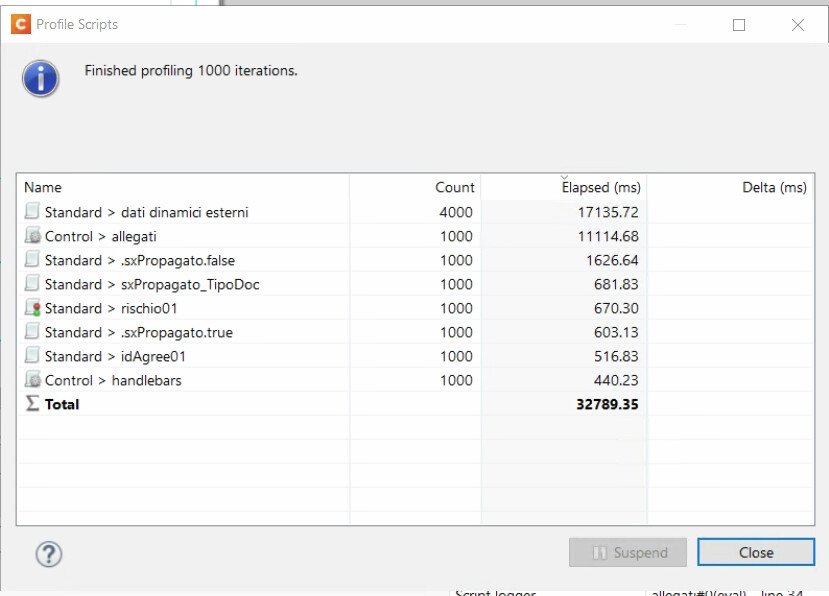
The template profiling is unclear for me, it performs 1000 iterations, I guess to make an average.
Is the Elapsed time the cumulative time of all iterations or is it already the mean of the 1000?
Furthermore, why the first script “dati dinamici esterni” is executed 4 times more?
This template when executed through the OLConnect API takes about 6 seconds to complete.