I wanted to give a shot at the node-red plugins for OLConnect, so I recreated a very basic workflow I have in the old fashioned Connect Workflow.
Since the connect resources were only in the Workflow I opened the Designer and used the Send to Server menu to submit datamapper, template job and output preset.
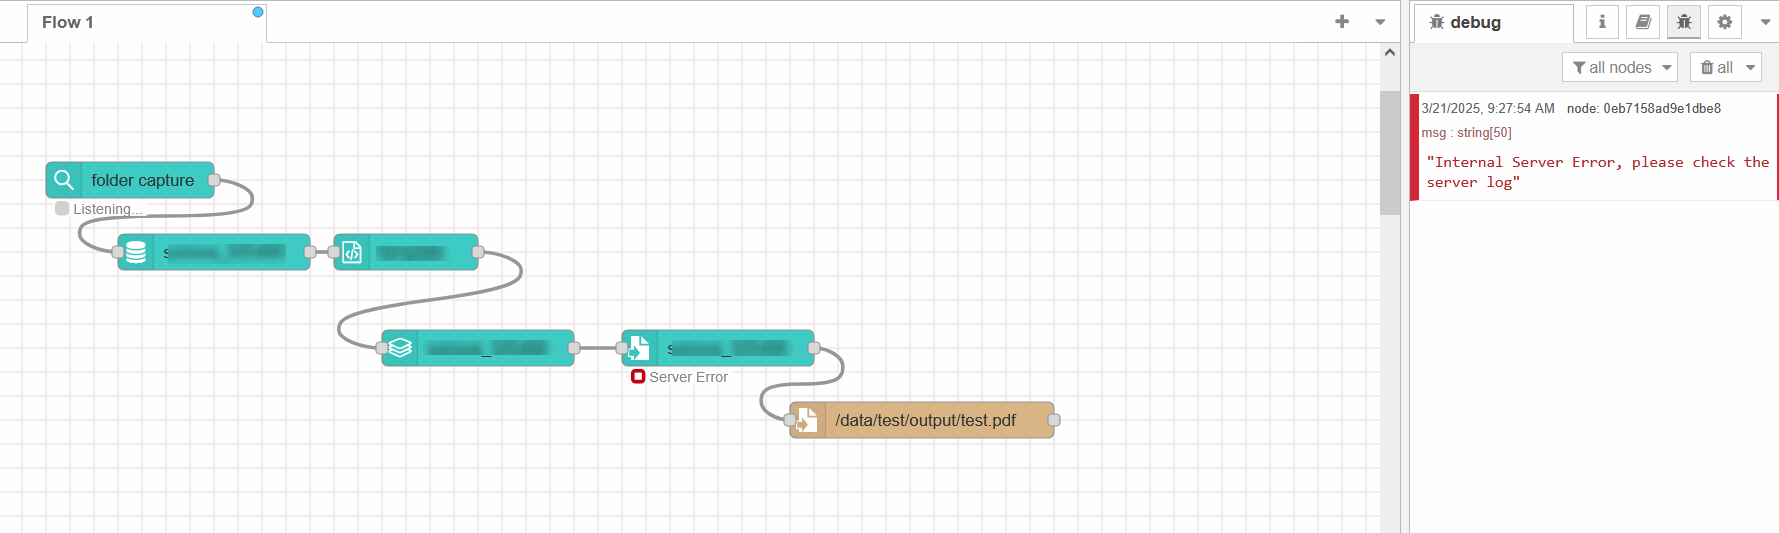
The workflow seems to work almost correctly:
the input file is loaded correctly
datamining completes
content creation completes
job preset completes
output preset fails with a generic error
The debug window of node-red simply reports
Internal Server Error, please check the server log
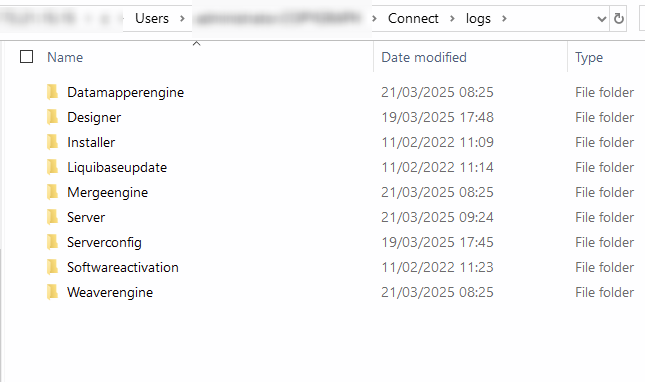
I’ve tried to browse \\...\c\Users\...\Connect\logs\Server for errors but there is not a single line with the string ERROR
Should I look into other logs? I’ve tried to browse around with not much success.
Sorry for the huge delay in the follow-up.
We eventually dropped Automate for a while, and I am coming back again to this issue only now that we have more time to test, learn and hopefully migrate to Automate.
I did explore the logs in the suggested path but at first glance there is no way I can correlate a log file with a specific flow run.
Are there nodes I can add in the node-red flow to debug some Connect ID to search in the logs?
Attaching a debug node only outputs the msg payload which is the error message itself.
I also tested the scenario with a forced fatalError('test') in the Template, when using the Workflow the error message is logged to the error viewer of the Workflow, when using Automate the error message doesn’t bubble up but a simple “The OL Connect Server had an internal error; check the server logs” is shown.
Please check the documentation per OL Connect Automate node to see what parameters it provides as output. It is not only msg.payload but also msg.managedFileId (file upload node), for example.
I’ve inspected the msg and I do have the IDs of the Connect resources involved.
What I’m struggling with is correlating those IDs to the actual logs. In %USERPROFILE%\Connect\logs I can’t find a clear way to map a specific workflow run to a specific log file or log section.
For example, if I execute a workflow now, how can I reliably identify the log lines related to that execution?
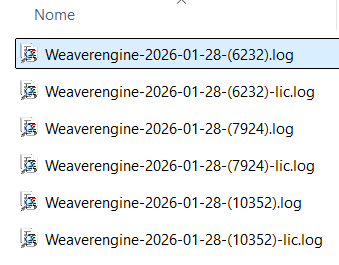
The server is processing many workflows in parallel, so the logs are large and noisy. For instance, on January 28th I have three log files, each ~100 MB with 300k+ lines.
Is there something specific I should be searching for to pinpoint log lines for a single workflow run, either from Automate or from the Designer?
See if you can find the IDs in those Weaverengine-<Date>-(<ID>).log files. (Do not confuse the ID in the filename of the Weaverengine log files as these are something different.)
@Maxiride if you use a Catch node and inspect msg.olError.olConnectServer.serverMsg you should see the responseText returned by the Connect Server endpoint.
You might want to sanitize it though; the error message is (in my opinion unnecessarily) verbose.
Disclaimer: I’m not involved with Automate, and I don’t know whether olError is public API. It may be an internal implementation detail that is subject to change.