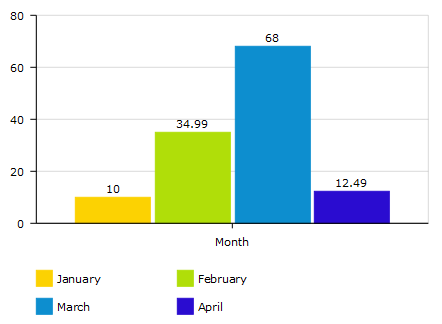
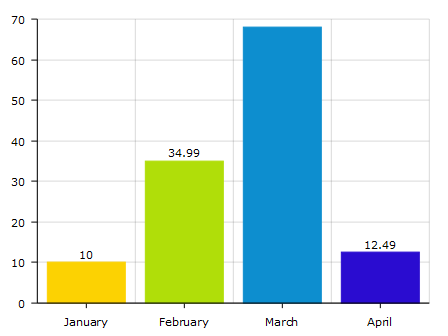
I have an xml file that has 3 lines of data for usage, I only want to use the last line of data, which I have been able to do. But I also want the print the data labels (month name) and I can’t seem to figure it out. Here is the code I have in place. Any help would be appreciated.
function Graph(field, title, color) {
this.field = field;
this.title = title;
this.color = color;
}
function getCopy(sourceArray, index) {
let source = sourceArray[0];
let target = {};
for (let prop in source){
target[prop] = source[prop];
}
return target;
}
let graphs = ;
field = “JAN”
graphs.push(new Graph(“Jan”, field, “#2A0CD0”));
field = “FEB”
graphs.push(new Graph(“Feb”, field, “#0D8ECF”));
field = “MAR”
graphs.push(new Graph(“Mar”, field, “#00CC00”));
field = “APR”
graphs.push(new Graph(“Apr”, field, “#FF6600”));
field = “MAY”
graphs.push(new Graph(“May”, field, “#0000CC”));
field = “JUN”
graphs.push(new Graph(“Jun”, field, “#CC0000”));
field = “JUL”
graphs.push(new Graph(“Jul”, field, “#CD0D74”));
field = “AUG”
graphs.push(new Graph(“Aug”, field, “#FCD202”));
field = “SEP”
graphs.push(new Graph(“Sep”, field, “#333333”));
field = “OCT”
graphs.push(new Graph(“Oct”, field, “#999999”));
field = “NOV”
graphs.push(new Graph(“Nov”, field, “#DDDDDD”));
field = “DEC”
graphs.push(new Graph(“Dec”, field, “#B0DE09”));
let detailTable = “Year”;
let categoryField = “Yr”;
let json = JSON.parse(results.attr(“data-amchart”));
let graphTemplate = json.graphs && json.graphs.length > 0 ? json.graphs : [{}];
let dataTemplate = json.dataProvider && json.dataProvider.length > 0 ? json.dataProvider : [{}];
if (json.type == “serial”) {
// Bar or Line chart
json.categoryAxis = { forceShowField: “category” };
json.categoryField = “category”;
json.graphs = ;
json.dataProvider = ;
if (categoryField) {
	// Multiple series based on detail records: x-axis has categories, y-axis has field values
	for (let graphIndex in graphs) {
		let graph = getCopy(graphTemplate, graphIndex);
		graph.title = graphs[graphIndex].title;
		graph.valueField = "value-" + graphIndex;
		if (!json.theme && !json.colors) {
			graph.lineColor = graphs[graphIndex].color;
		}
		json.graphs.push(graph);
	}

	if (detailTable) {
		let table = record.tables[detailTable];
			let data = getCopy(dataTemplate);
			for (let graphIndex in graphs) {
				data.category = graphs[graphIndex].title;
				data[json.graphs[graphIndex].valueField] = table[2].fields[graphs[graphIndex].field];
			}
			json.dataProvider.push(data);
	}
}
}
results.attr(“data-amchart”, JSON.stringify(json));

