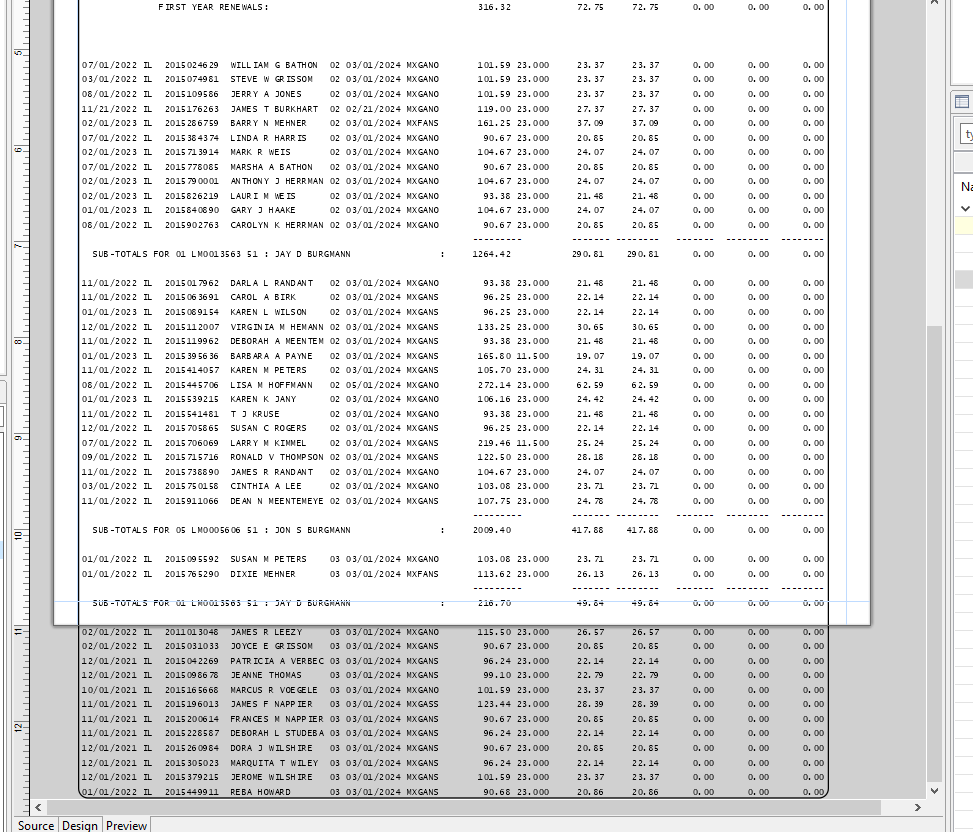
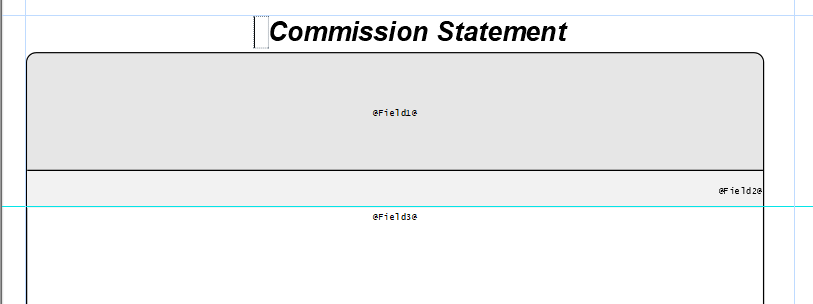
I have an issue where I have a table with 3 rows and 1 column. On the third row I have a field that is getting data until the page break. The problem I have is that the data is sometimes overflowing and looks like this.
So I checked on the datamapper settings to have the page break on 66 lines which would be the length of the page. But then the issue i have is that I have a condition to only print the pages that have “RUN” on the top left. So this extra data was just being cut off and lost.
I came up with a potential solution but I was wondering if there is a better approach because my solution changes the line height of the bottom cell based on the amount of
tags in the field using this script I set up:
var result;
var string;
result = '<p style="line-height: 100%;">';
string = result + record.fields['Field3'];

// Function to count occurrences of a substring in a string
function countOccurrences(string, subString) {
    return string.split(subString).length - 1;
}

// Get the content of Field3
var field3Content = record.fields['Field3'];

// Count the occurrences of <br />
var brCount = countOccurrences(field3Content, "<br />");

//If <br /> counts are greater than or equal to 54, apply line height reducing html string
if (brCount >= 54) {
    string = result + record.fields['Field3']
}
else {
    string = record.fields['Field3'];
}
//Load results
results.html(string);
This inputs the html formatting text in front of the field to change the line height based on the count of br tags as stated above, but then I don’t know if the amount of data has a max limit because it could still overflow after applying this script if it were long enough. I could put another condition to decrease the line height even further after even more br tags, but it would be ideal to just be able to set it so it automatically adjusts to fit in the page. I looked into copyfitting, but it only works for div containers or boxes and it also just changes the font size, which in my case messes up the formatting.
If anyone has an idea better than mine please let me know.

